d3 @ ft
@jburnmurdoch, interactive data journalist
How the Financial Times uses d3.js for interactive and animated data visualisations
Animation to bring life to a story
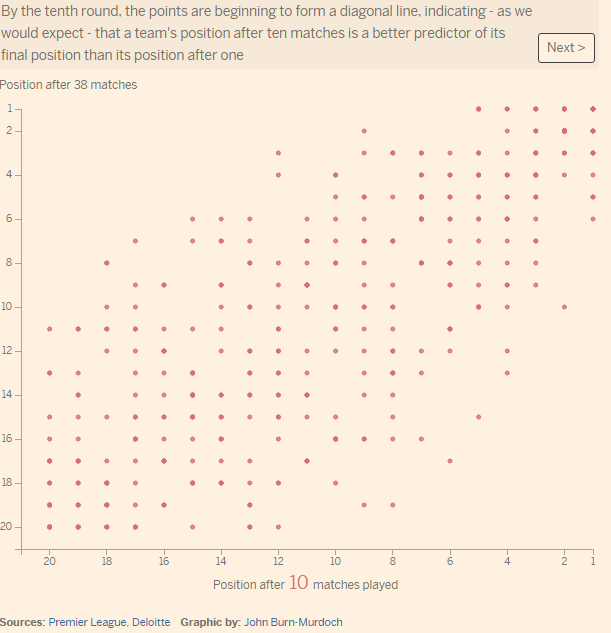
To illustrate a statistical concept
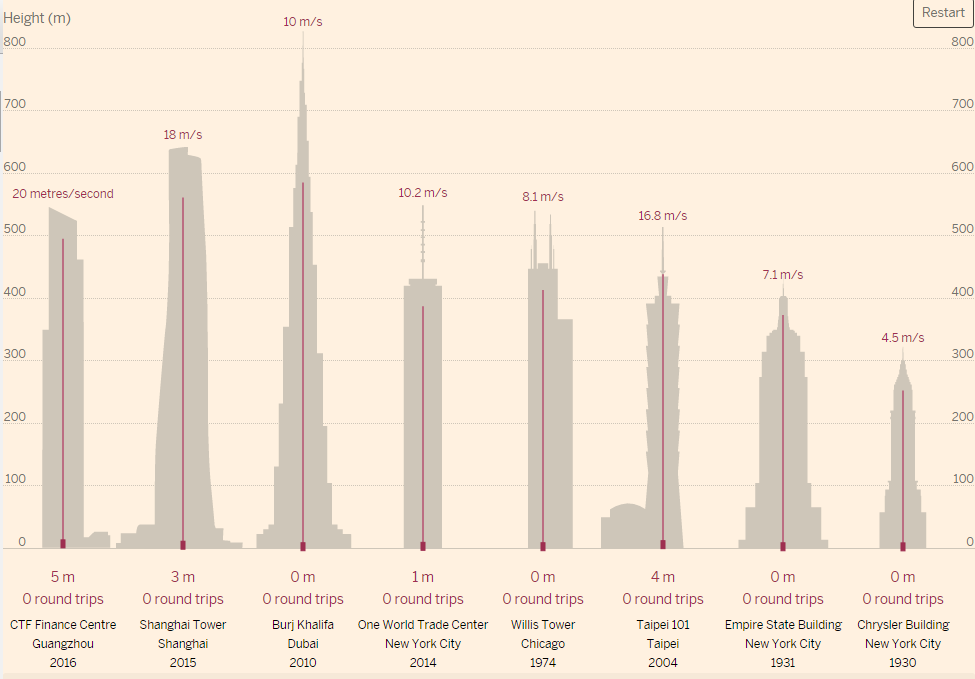
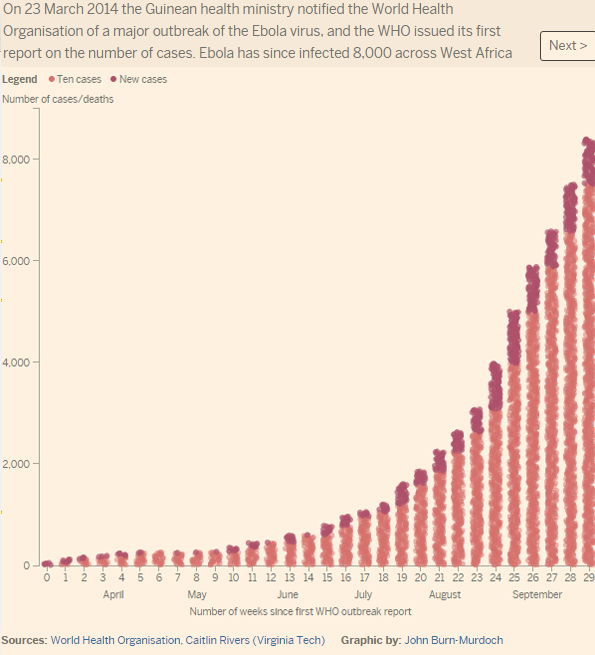
To indicate magnitude, pace
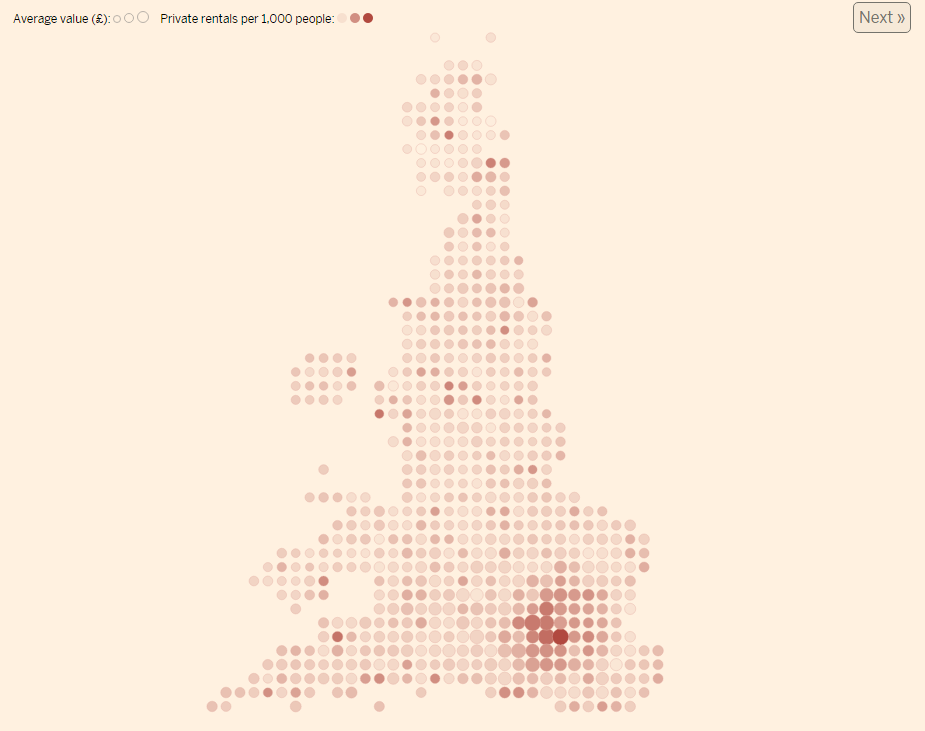
To link across narratives
Animation as a storytelling medium
Signalling a change has taken place
Optimising transitions for mobile
Trick: SVG filters
Trick: the SVG use element
Resources
Scott Murray's brilliant tutorials
...and introduction to transitions
Sara Soueidan on SVG